People who manage software development projects become sensitive to code convergence, the changes that software goes through as its defects are found and removed to get it ready to ship. This takes time because
- testing all the code takes time
- fixing defects takes time
- removing defects requires changing code which introduces more defects.
- using the product to get a feel for the overall level of maturity
- plotting number of open (found but not yet fixed) defects vs. date
- plotting code churn vs. date
Software Project Model
This model starts when the code in the hypothetical project is functioning then it runs for one year of one week development cycles. In each week the development organization fixes as many bugs as it can and a separate QA organization tests the development organization's code from the previous week. The model's input parameters are
- Initial bugs: The number of bugs in the code when the model starts.
- Average number of lines of code (LOC) change to fix a bug.
- Average number of bugs introduced per LOC changed.
- Maximum number of bugs that the development organization can fix each week.
- QA test cycle.
- The fastest and slowest bug find rates in the QA test cycle.
The model outputs
- Remaining bugs in code. This is the model's actual maturity. It cannot be observed directly so it needs to be estimated from the other output parameters.
- Open bugs (bugs found but not yet fixed)
- Code churn.
- Fraction of bugs that were introduced in the previous week.
This is a very simple model and does not take into account many of the things that happen in real-world software development. In particular it does not take into account the lags between introducing a bug, finding it and fixing it, which often have a major impact on project convergence. The spreadsheet that implements the model is at the end of this post.
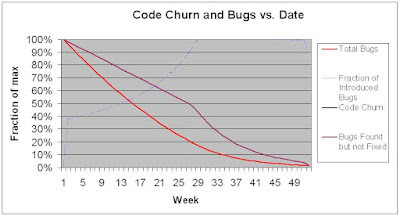
The following graphs show the model outcomes for 4 sets of input parameters.
initial bugs: 1000
bugs introduced per loc: 0.007
loc to fix a bug: 100
max bugs fixed per week: 120
max bugs found per week: 200
min bugs found per week: 50
QA test cycle(weeks): 8
initial bugs: 500
bugs introduced per loc: 0.009
loc to fix a bug: 100
max bugs fixed per week: 120
max bugs found per week: 200
min bugs found per week: 50
QA test cycle(weeks): 8
initial bugs: 500
bugs introduced per loc: 0.009
loc to fix a bug: 100
max bugs fixed per week: 200
max bugs found per week: 200
min bugs found per week: 200
QA test cycle(weeks): 8
initial bugs: 500
bugs introduced per loc: 0.009
loc to fix a bug: 100
max bugs fixed per week: 100
max bugs found per week: 200
min bugs found per week: 100
QA test cycle(weeks): 8
What the Metrics Say About the Models
- Using the product to get a feel for the overall level of maturity. This was necessary in most cases because the long term trends were different to the short term trends. The gradients in the number of open (found but not yet fixed) bugs and code churn graphs did not predict code stabilization directly. The exception to this was when there was no pattern in the bug find rate. Bug find rates cannot be guaranteed to not have patterns, so using the product is necessary, as common sense would have suggested.
- Plotting number of open defects vs. date. This graph trended in the same direction as the number of remaining underlying defects in code so it was a good metric. Some work is required to filter out the effects of the bug find rate.
- Plotting code churn vs. date. This graph trended in the same direction as the number of remaining underlying defects in code so it was a good metric. Some work is required to filter out the effects of the bug find rate.
The metrics work for the simple model. Schedule predictions require that code churn and number of open defects need to be corrected for bug find rate, or patterns need to be removed from the bug find rate. One way to remove bug find patterns is to measure bugs with an automated test system where tests are selected by a random number generator. See test automation for complex systems.
The Model


2 comments:
I like the idea of "using the product" to get a feel for how it performs. That probably has a whole host of beneficial side-effects beyond product convergence.
Otherwise, I wonder if "convergence" is the wrong concept and metric. Why build something off-target that needs to converge later in the first place? It's that a tremendous waste? In the time of Agile and Test-driven development this question strikes me an anachronism.
Wolfram,
Most of the problems I have encountered in software product development have been due to upstream development activities not being done properly. It has always cost more to fix these problems downstream than it would have cost to have done the upstream development right in the first place.
Given the number of software projects that miss schedule and/or ship with too many bugs, I would guess that many development organizations are still short-changing upstream development activities such as testing and design.
Are you seeing better behavior among development organizations than me?
Post a Comment